
British Columbia became the first province to adopt fixed-date election laws in 2001, and the law first took effect for the province’s general election of 2005. Newfoundland and Labrador followed suit and enacted Canada’s second fixed-date election law in 2004, which first applied to the general election in 2007. Some Canadian scholars hailed this initial wave of provincial fixed-date election laws in the mid- to late-2000s as a panacea that would rebalance the “democratic deficit” – a fashionable phrase fifteen to twenty years ago – vanquish political cynicism, and increase voter turnout. Henry Milner speculated fervently in 2005 that fixed-date elections would complement efforts to increase voter turnout, though without necessarily doing so directly themselves.
Beyond this, fixed election dates could enhance the effectiveness of a variety of measures designed to actively boost voter turnout.[1] […] This does not mean that moving toward fixed voting dates will in itself reverse Canada’s low and declining voter turnout; but it is a necessary component of a systematic effort to address this pressing issue.[2]
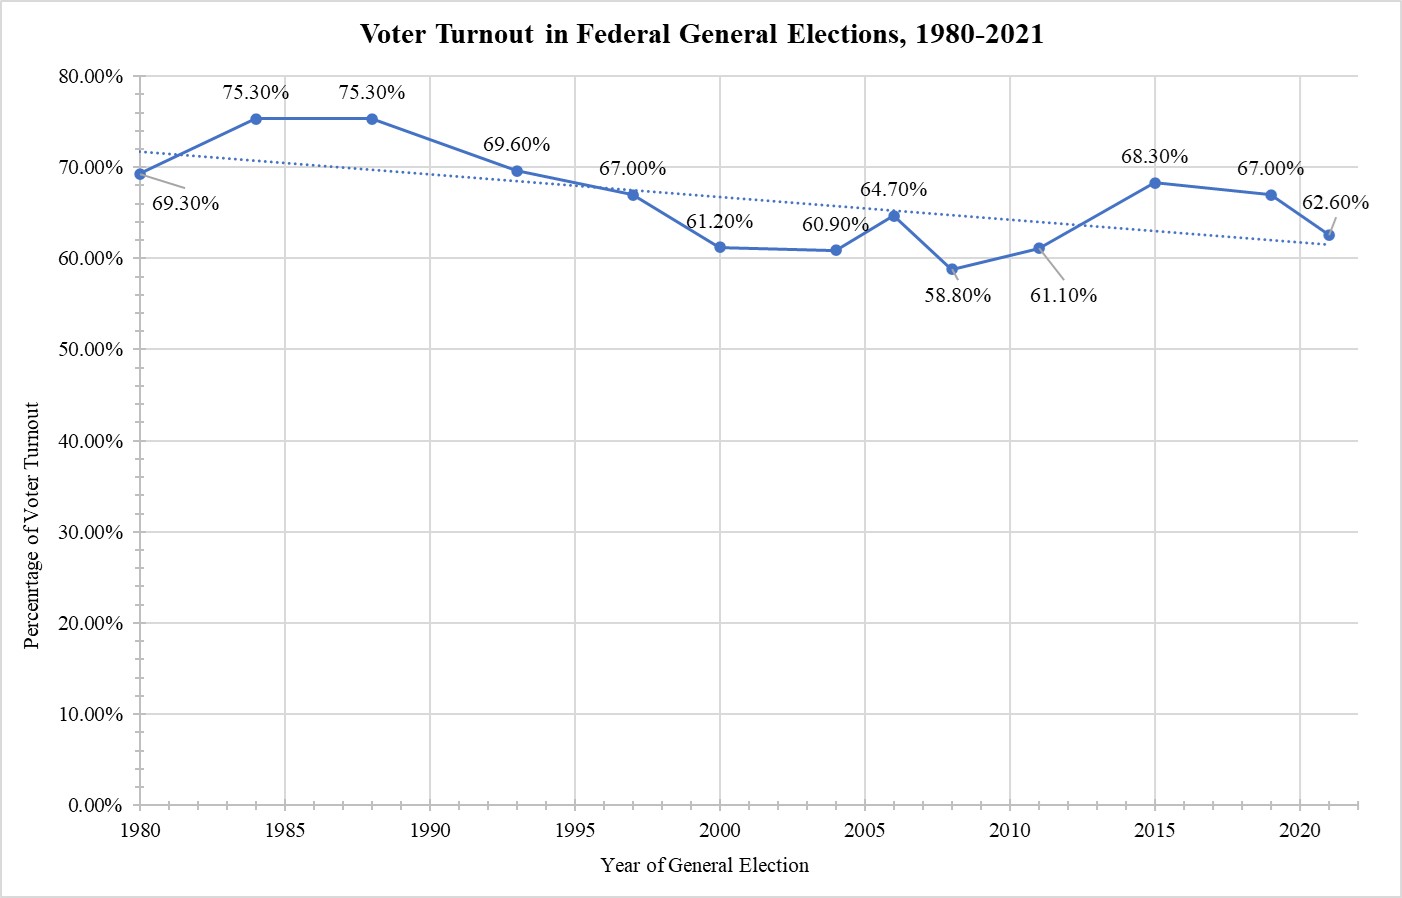
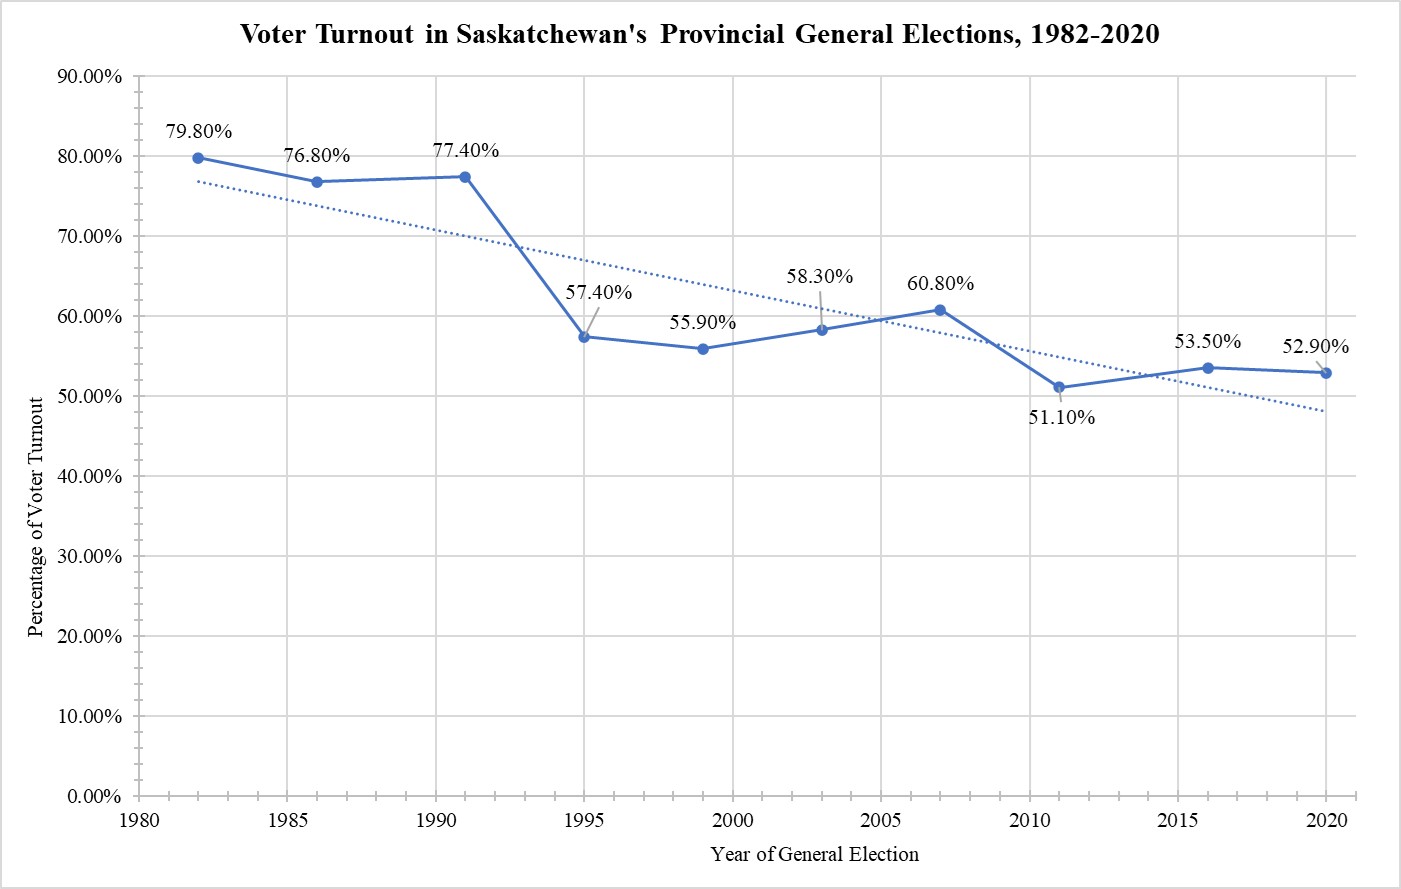
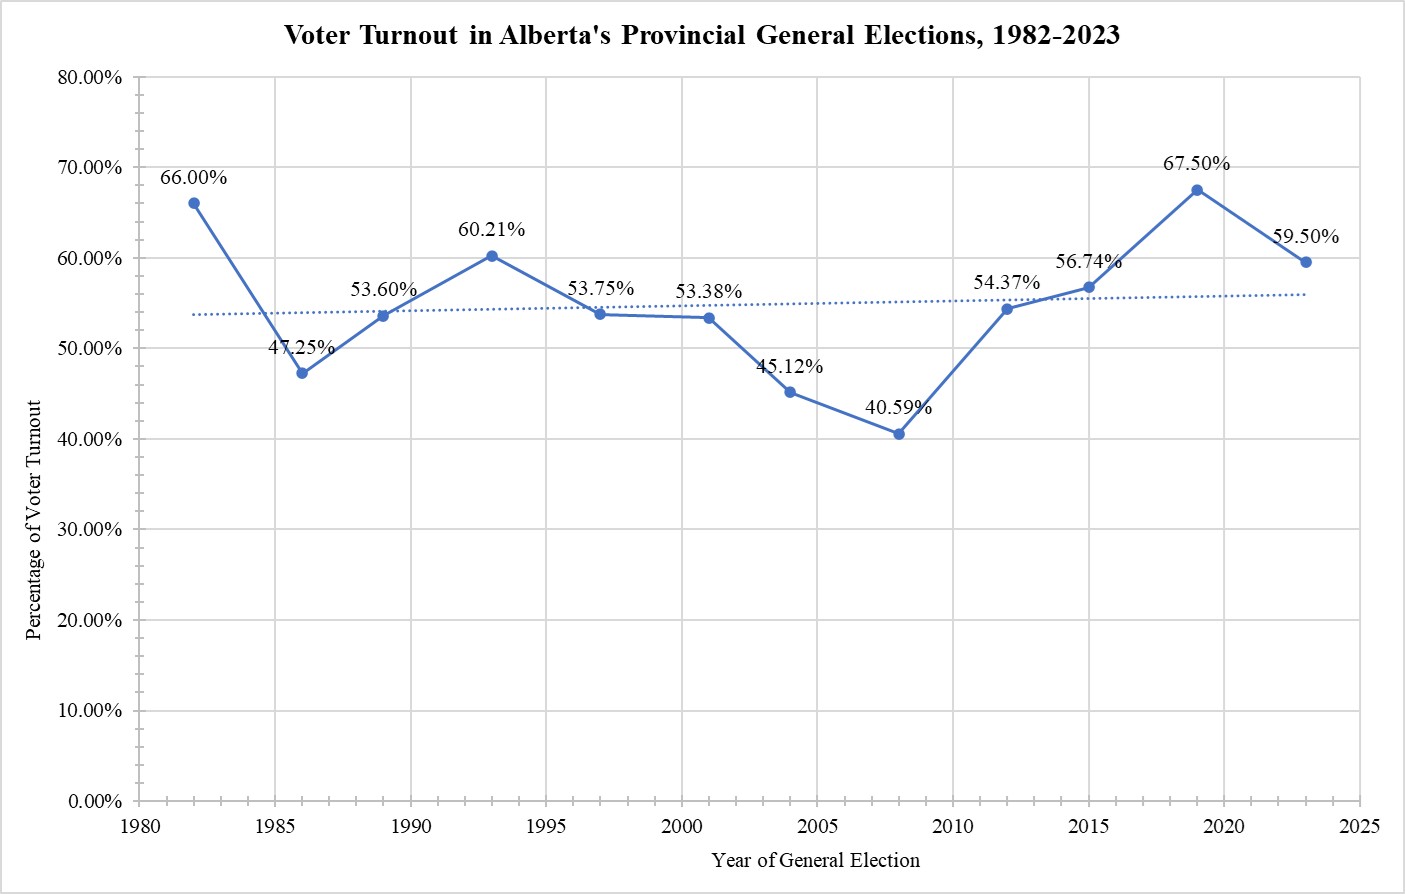
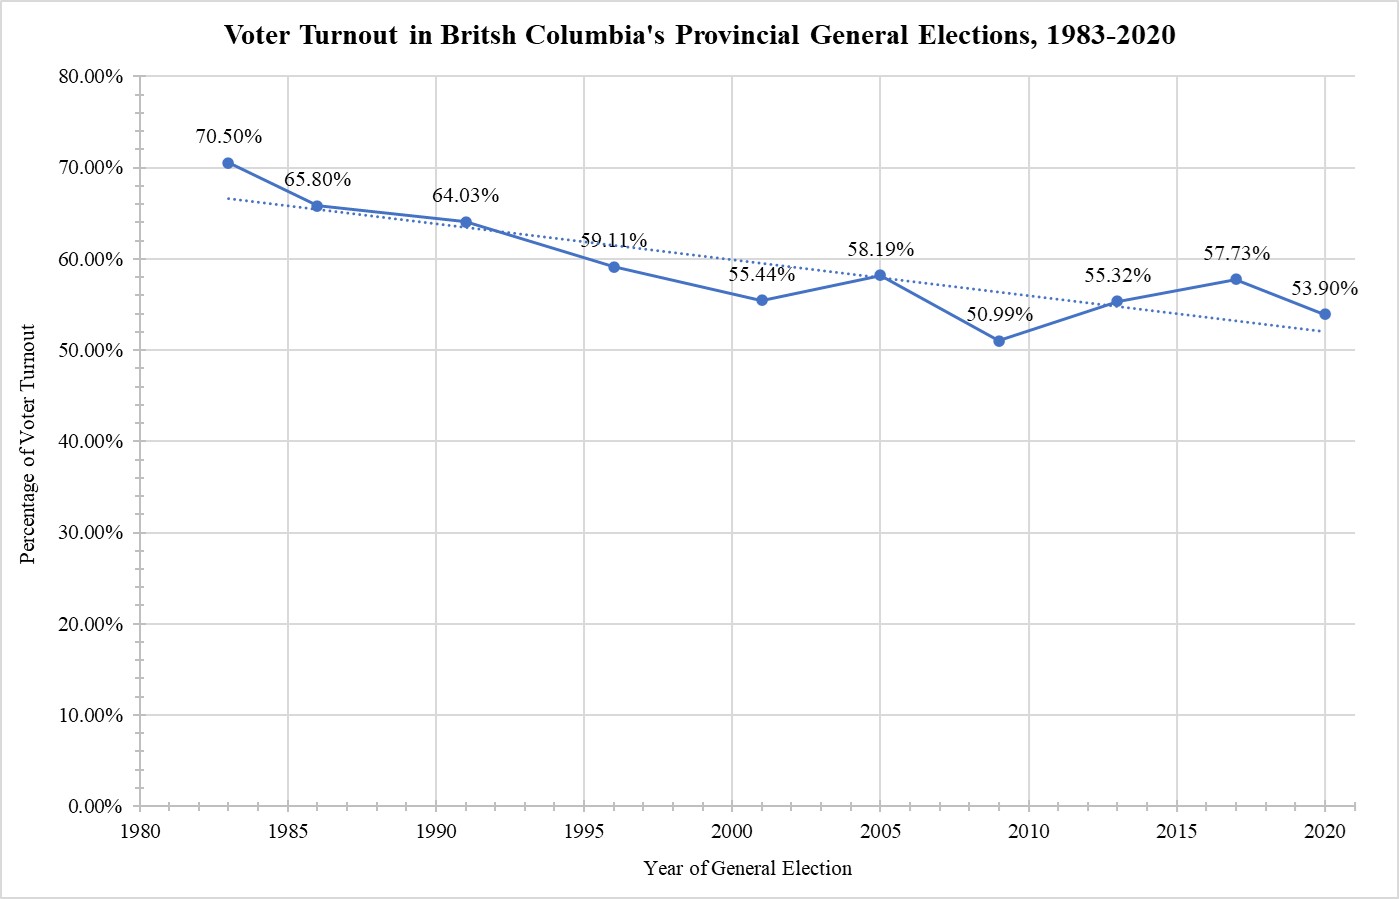
Now that we have run this experiment for ten to almost twenty years in most jurisdictions, we can examine the statistical trends: the statistics do not bear out this hypothesis. Voter turnout has either continued to decline or has levelled out since the advent of fixed-date election laws in Canada and in all provinces, except for in Alberta, where its transition toward a two-party system with increased competition and choice in elections since 2012 probably explains higher turnout.
In the following charts, I noted the general elections which have taken place since the fixed-date elections law first applied, though these lists include both scheduled and snap general elections. I have drawn the data from the official reports of Chief Electoral Officers or from the website of the relevant elections agency.
Canada[3]
| Year | Voter Turnout |
| 1980 | 69.30% |
| 1984 | 75.30% |
| 1988 | 75.30% |
| 1993 | 69.60% |
| 1997 | 67.00% |
| 2000 | 61.20% |
| 2004 | 60.90% |
| 2006 | 64.70% |
| 2008 | 58.80% |
| 2011* | 61.10% |
| 2015* | 68.30% |
| 2019* | 67.00% |
| 2021* | 62.60% |
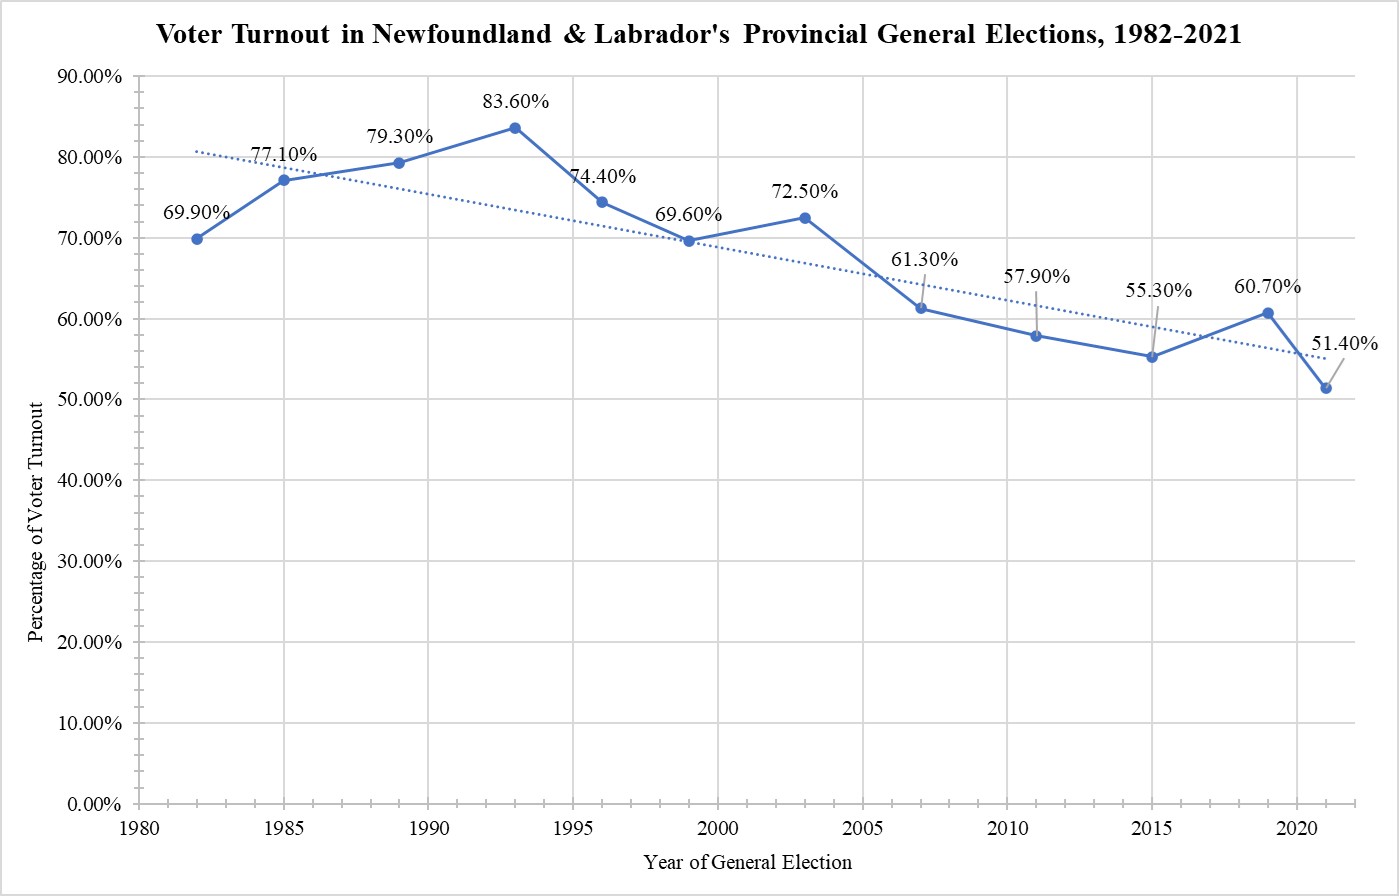
Newfoundland & Labrador[4]
| Year of General Election | Voter Turnout |
| 1982 | 69.90% |
| 1985 | 77.10% |
| 1989 | 79.30% |
| 1993 | 83.60% |
| 1996 | 74.40% |
| 1999 | 69.60% |
| 2003 | 72.50% |
| 2007* | 61.30% |
| 2011* | 57.90% |
| 2015* | 55.30% |
| 2019* | 60.70% |
| 2021* | 51.40% |
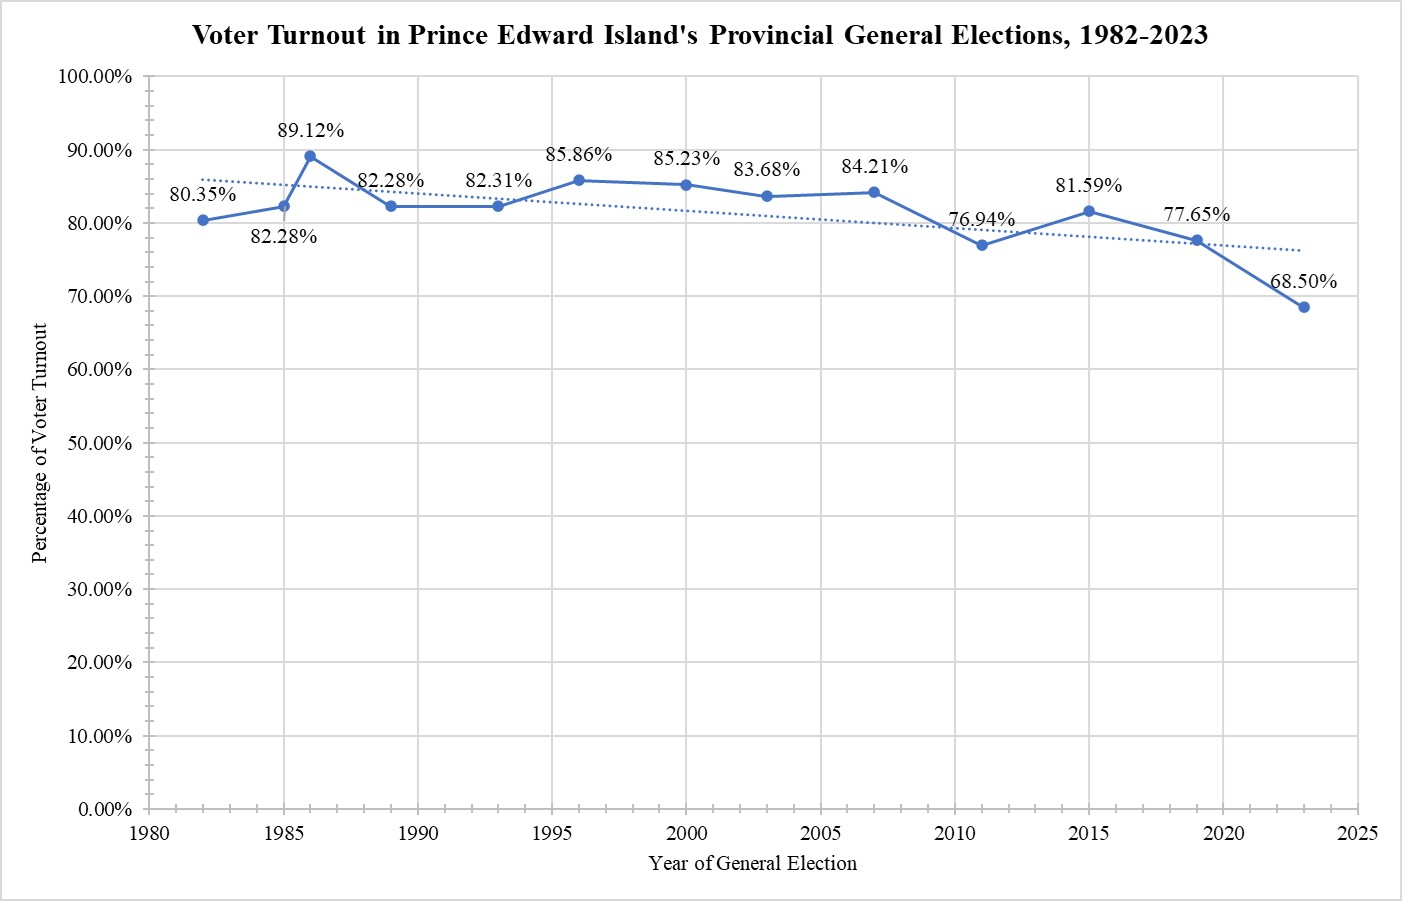
Prince Edward Island[5]
| Year of General Election | Voter Turnout |
| 1982 | 80.35% |
| 1985 | 82.28% |
| 1986 | 89.12% |
| 1989 | 82.28% |
| 1993 | 82.31% |
| 1996 | 85.86% |
| 2000 | 85.23% |
| 2003 | 83.68% |
| 2007 | 84.21% |
| 2011* | 76.94% |
| 2015* | 81.59% |
| 2019* | 77.65% |
| 2023* | 68.50% |
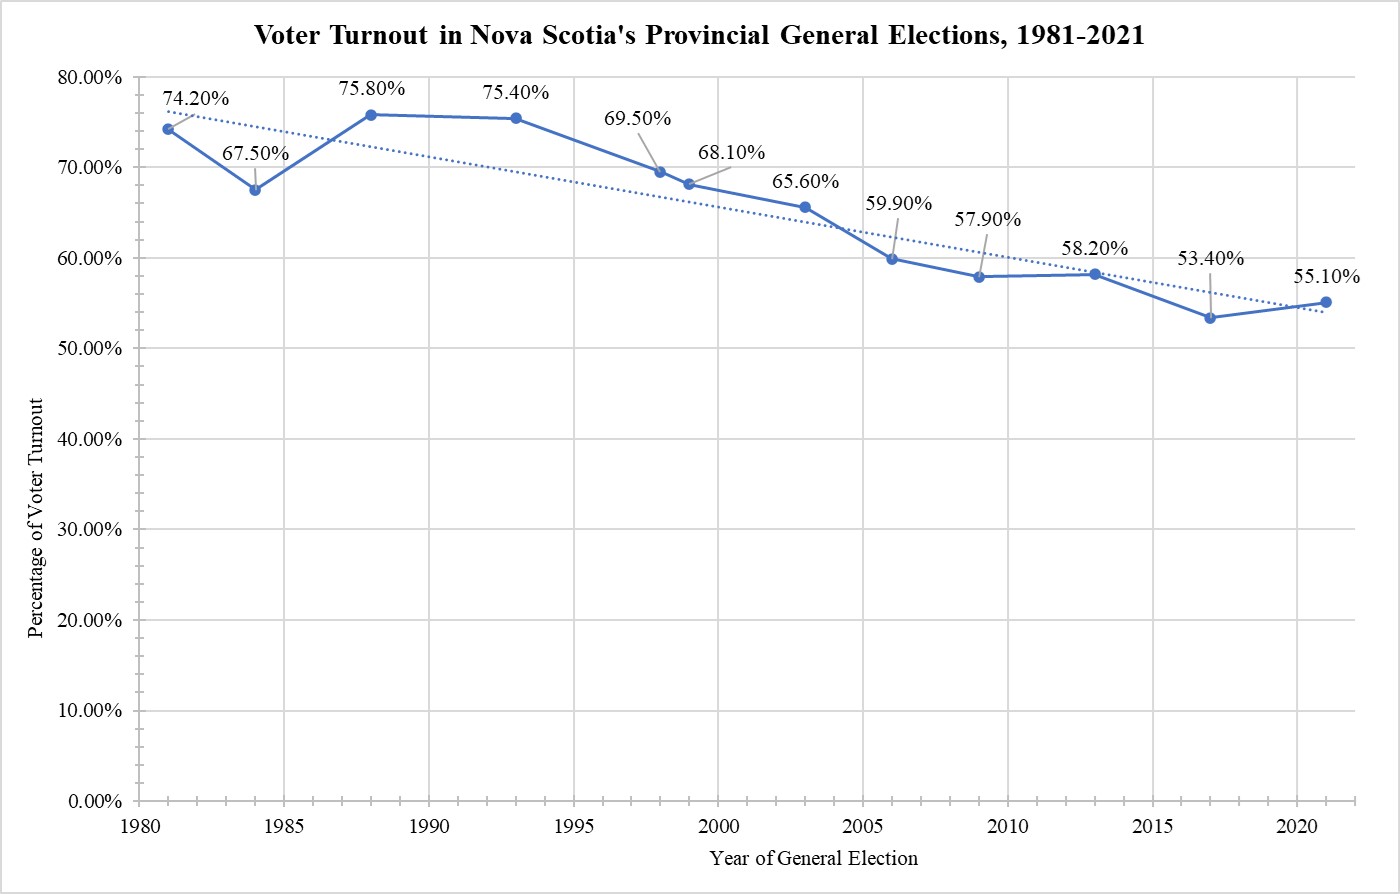
Nova Scotia[6]
| Year of General Election | Voter Turnout |
| 1981 | 74.20% |
| 1984 | 67.50% |
| 1988 | 75.80% |
| 1993 | 75.40% |
| 1998 | 69.50% |
| 1999 | 68.10% |
| 2003 | 65.60% |
| 2006 | 59.90% |
| 2009 | 57.90% |
| 2013 | 58.20% |
| 2017 | 53.40% |
| 2021 | 55.10% |
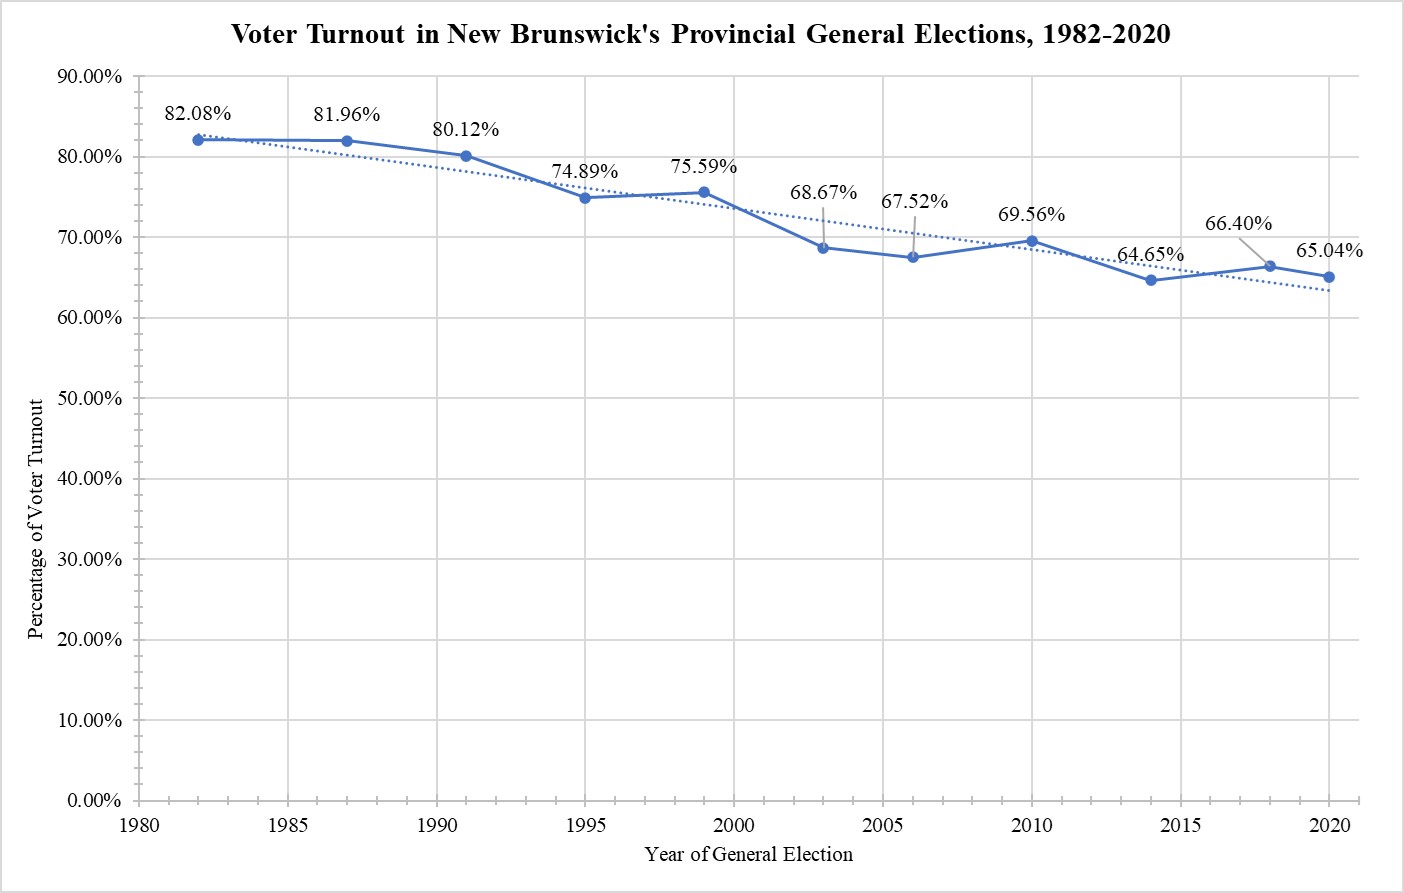
New Brunswick[7]
| Year of General Election | Voter Turnout |
| 1982 | 82.08% |
| 1987 | 81.96% |
| 1991 | 80.12% |
| 1995 | 74.89% |
| 1999 | 75.59% |
| 2003 | 68.67% |
| 2006 | 67.52% |
| 2010* | 69.56% |
| 2014* | 64.65% |
| 2018* | 66.40% |
| 2020* | 65.04% |
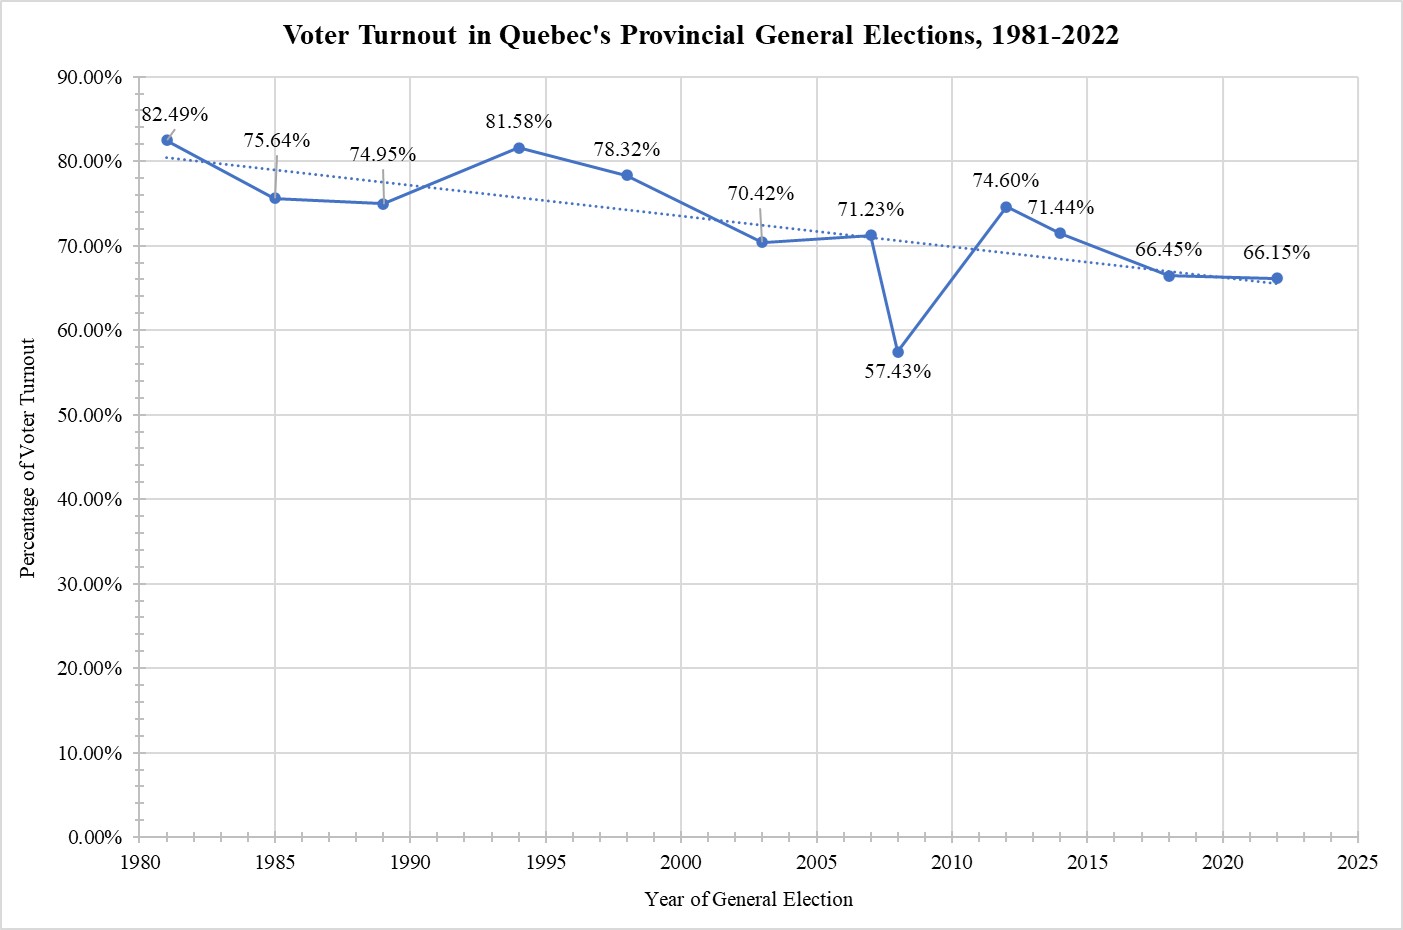
Quebec[8]
| Year of General Election | Voter Turnout |
| 1981 | 82.49% |
| 1985 | 75.64% |
| 1989 | 74.95% |
| 1994 | 81.58% |
| 1998 | 78.32% |
| 2003 | 70.42% |
| 2007 | 71.23% |
| 2008 | 57.43% |
| 2012 | 74.60% |
| 2014* | 71.44% |
| 2018* | 66.45% |
| 2022* | 66.15% |
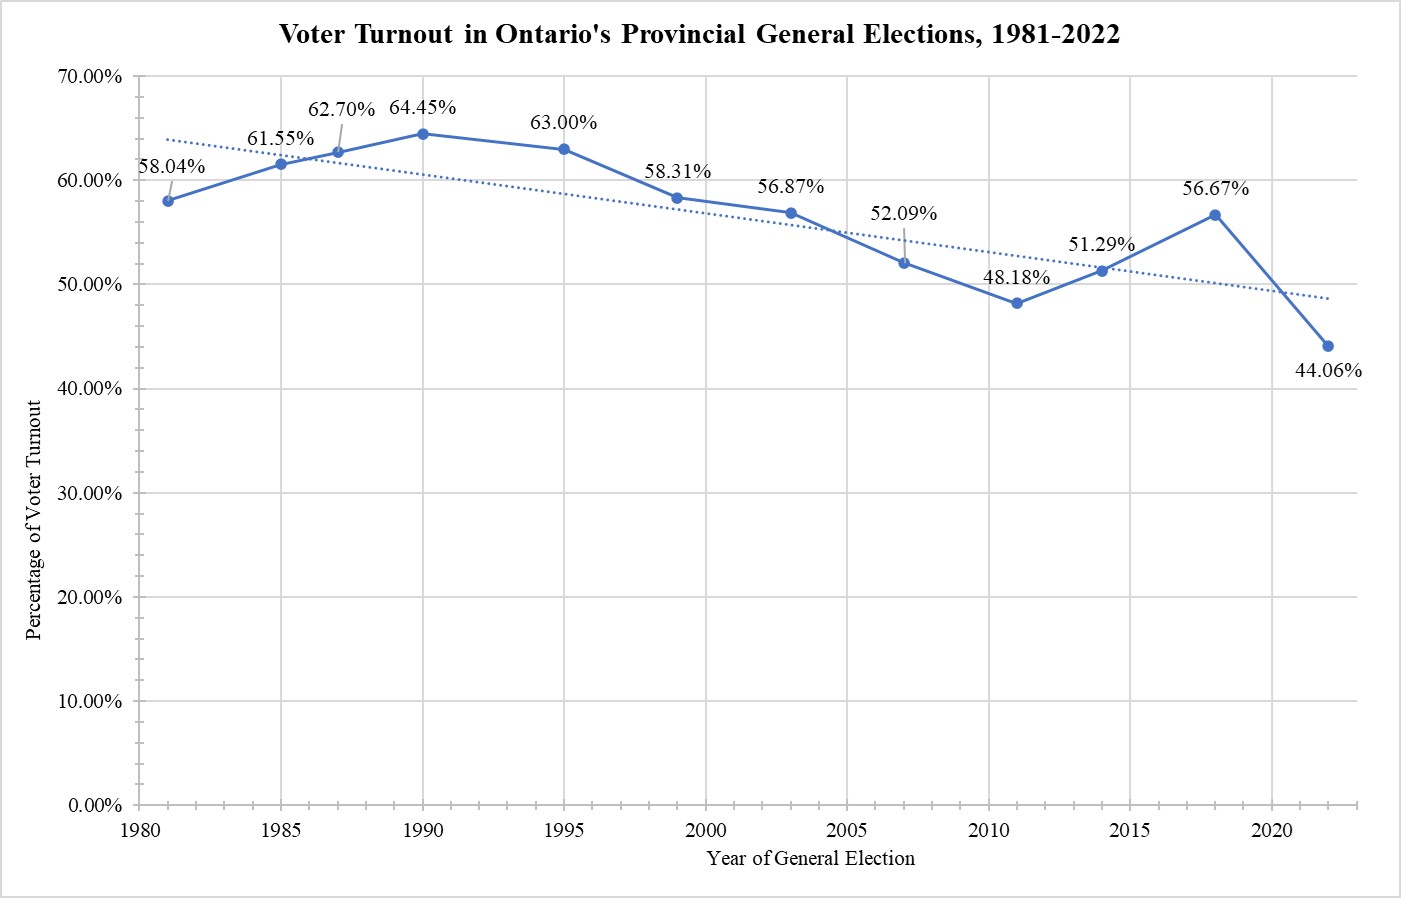
Ontario[9]
| Year of General Election | Voter Turnout |
| 1981 | 58.04% |
| 1985 | 61.55% |
| 1987 | 62.70% |
| 1990 | 64.45% |
| 1995 | 63.00% |
| 1999 | 58.31% |
| 2003 | 56.87% |
| 2007 | 52.09% |
| 2011* | 48.18% |
| 2014* | 51.29% |
| 2018* | 56.67% |
| 2022* | 44.06% |
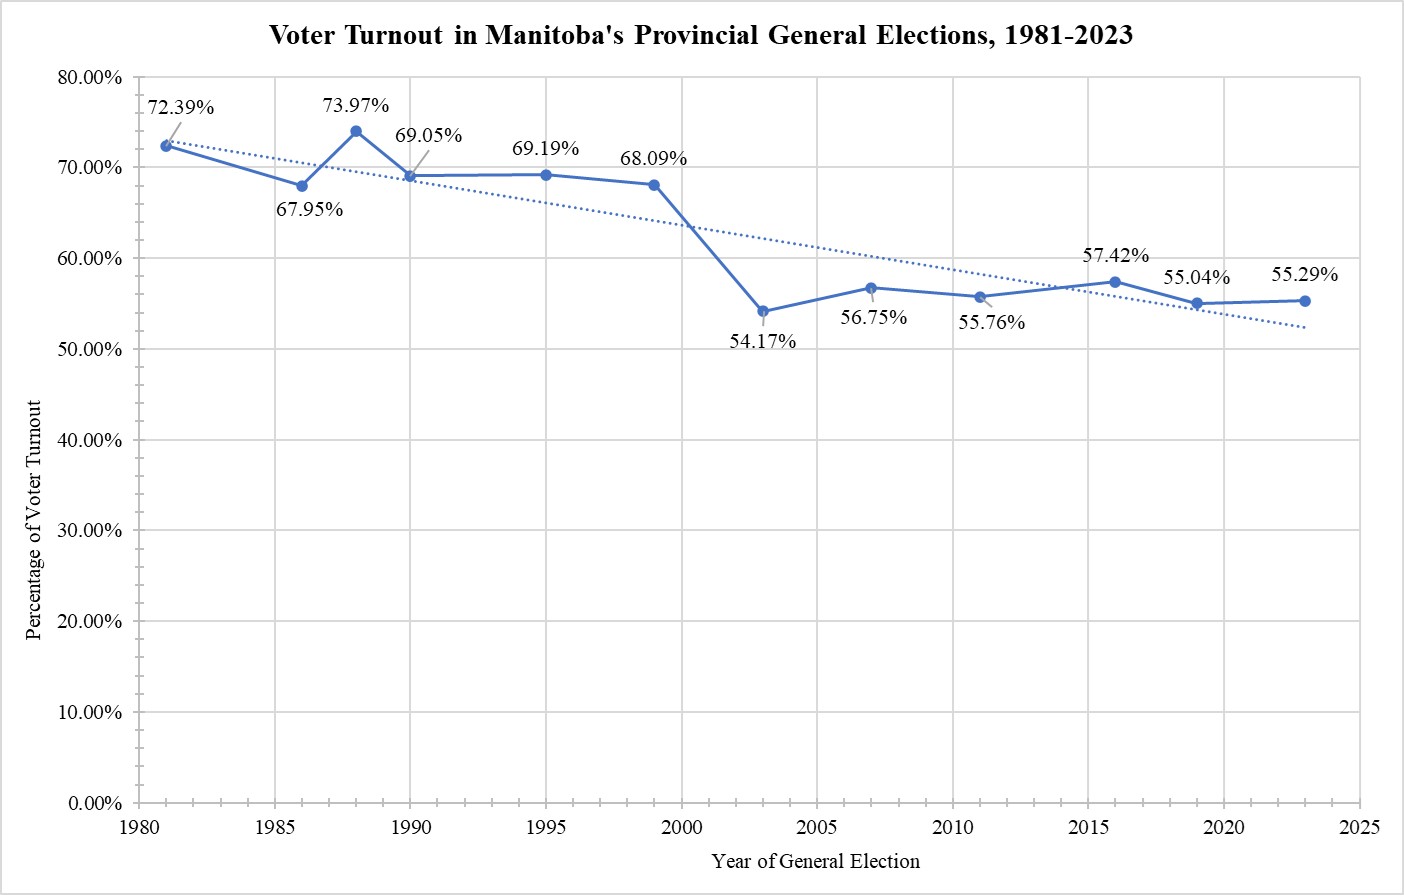
Manitoba[10]
| Year of General Election | Voter Turnout |
| 1981 | 72.39% |
| 1986 | 67.95% |
| 1988 | 73.97% |
| 1990 | 69.05% |
| 1995 | 69.19% |
| 1999 | 68.09% |
| 2003 | 54.17% |
| 2007 | 56.75% |
| 2011* | 55.76% |
| 2016* | 57.42% |
| 2019* | 55.04% |
| 2023* | 55.29% |
Saskatchewan[11]
| Year of General Election | Voter Turnout |
| 1982 | 79.80% |
| 1986 | 76.80% |
| 1991 | 77.40% |
| 1995 | 57.40% |
| 1999 | 55.90% |
| 2003 | 58.30% |
| 2007 | 60.80% |
| 2011* | 51.10% |
| 2016* | 53.50% |
| 2020* | 52.90% |
Alberta[12]
| Year of General Election | Voter Turnout |
| 1982 | 66.00% |
| 1986 | 47.25% |
| 1989 | 53.60% |
| 1993 | 60.21% |
| 1997 | 53.75% |
| 2001 | 53.38% |
| 2004 | 45.12% |
| 2008 | 40.59% |
| 2012* | 54.37% |
| 2015* | 56.74% |
| 2019* | 67.50% |
| 2023* | 59.50% |
British Columbia[13]
| Year of General Election | Voter Turnout |
| 1983 | 70.50% |
| 1986 | 65.80% |
| 1991 | 64.03% |
| 1996 | 59.11% |
| 2001 | 55.44% |
| 2005* | 58.19% |
| 2009* | 50.99% |
| 2013* | 55.32% |
| 2017* | 57.73% |
| 2020* | 53.90% |
Similar Posts:
- Fixed-Date Elections
- Bowden, James W.J. “Reining in the Crown’s Authority Over Dissolution: Canada’s Fixed-Date Election Laws versus the Fixed-Term Parliaments Act of the United Kingdom.” M.A. Thesis, Carleton University, September 2018.
Notes
[1] Henry Milner, “Fixing Canada’s Unfixed Election Dates,” Institute for Research on Public Policy: Policy Matters 6, no. 6 (December 2005): 3.
[2] Henry Milner, “Fixing Canada’s Unfixed Election Dates,” Institute for Research on Public Policy: Policy Matters 6, no. 6 (December 2005): 23.
[3] Elections Canada, “Voter Turnout at Federal Elections and Referendums,” 10 October 2023 [accessed 10 November 2023].
[4] Elections Newfoundland & Labrador, “Historical General Election Statistics (1949-2019)” in 2021 Provincial General Election Report (St. John’s: Chief Electoral Officer, 10 November 2021), at page 352.
[5] Elections Prince Edward Island, “2023 Provincial General Election,” Press Release of 3 April 2023; Elections Prince Edward Island, “Historical Statistics on Provincial General Elections from 1966 to 2019,” in Report of the Chief Electoral Officer of PEI: 2019 Provincial General Election (Charlottetown: Chief Electoral Officer, 12 November 2019), at page 37. Prince Edward Island used dual-member districts from the general elections of 1893 to 1993, inclusive. The general election in 1996 was the first to feature single-member districts. From 1982 to 1993, I have opted for the voter turnout for assemblymen rather than for councillors.
[6] Elections Nova Scotia, “Historical Voter Turnout,” in 40th Provincial General Election: Volume I – Statement of Votes & Statistics (Halifax: Chief Electoral Officer, September 2017), at page 1-39; Elections Nova Scotia, “Historical Voter Turnout,” in 41st Provincial General Election: Volume I – Statement of Votes & Statistics (Halifax: Chief Electoral Officer, 31 January 2022), at page 36.
[7] Elections New Brunswick, “Comparative Statistics – General Elections, 1967 to 2020,” in Report of the Chief Electoral Officer: Fortieth General Provincial Election: September 14, 2020 (Fredericton: Chief Electoral Officer, 15 February 2021), at page 26.
[8] Elections Quebec, “Statistics on General Elections Held Since 1867: Voter Turnout,” accessed 9 November 2023.
[9] Elections Ontario, “General Elections Statistics from the Records,” accessed 9 November 2023.
[10] Elections Manitoba, “Official Results: Manitoba’s 43rd General Election – October 3, 2023,” accessed 10 November 2023; Elections Manitoba, “Voter Turnout in Manitoba Provincial Elections: 1981 to 2019,” in Statement of Votes for the 42nd Provincial General Election: September 10, 2019 (Winnipeg: Chief Electoral Officer, 2019), at page 20.
[11] Elections Saskatchewan, “Voter Turnout” in A Report on the Twenty-Ninth General Election: Volume I – Statement of Votes (Regina: Chief Electoral Officer, 30 June 2021), at page 17.
[12] Elections Alberta, “Election Results: Provincial General Election, May 29, 2023,” accessed 10 November 2023; Elections Alberta, “Comparative Statistics: Overall Summary of Ballots Cast and Percentage of Voter Turnout,” 2019 General Election: A Report of the Chief Electoral Officer, Volume Iv (Edmonton: Chief Electoral Officer, March 2020), at page 75.
[13] Elections British Columbia, “Figure 14: Voter Participation in Provincial General Elections, 2001-2020,” in Report of the Chief Electoral Officer: Provincial General Election, October 24, 2020 (Victoria: Chief Electoral Officer, 27 July 2021), at page 54; Elections British Columbia, “Figure 7: Voter Participation, 1983-2017,” in Report of the Chief Electoral Officer: Provincial General Election, May 9, 2017 (Victoria: Chief Electoral Officer, 12 March 2018), at page 56. In this particular report, Elections British Columbia distinguishes between two metrics: “turnout as a percentage of registered voters” (which is invariably higher) versus “turnout as a percentage of estimated eligible voters).” The other provincial elections agencies do not distinguish between the two, but their reports probably use the latter, lower metric. The report from 2021 cites only the percentage of estimated eligible voters, so I have used this metric throughout to preserve the consistency of British Columbia’s statistics.

Greetings from Down Under James,
I just discovered your blog after searching for images of the “two swords distance between red lines in the House of Commons” and coming upon https://parliamentum.org/2011/07/28/two-swords-and-one-inch-apart/
I can but say thank the good Lord/Jesus/Buddha/Allah/Krishna/Waugal (local spirit to me https://www.noongarculture.org.au/spirituality/) that in Australia we have compulsory attendance at the polling place. Obviously it cannot be “compulsory voting” because it’s secret ballot (aka “Australian ballot” 🙂
I certainly makes the election outcome more legitimate, and allows a cooler political debate, rather than having to rile voters to get off their proverbials. Plus it’s only a minor fine if you don’t vote. Turnout is generally around 90% https://www.aec.gov.au/elections/federal_elections/voter-turnout.htm
I personally put it in the same category as compulsory education. Some people will go right through 12 or more years of schooling, and never learn how to read or write. But I’d never want parents to do as they wish with their children. We The People need to have standards!
By the way, I personally support the idea of fixed term elections. I think the next great leap forward for MRD (Modern Representative Democracy…. which has little to do with Ancient Greek democracy!) will be the implementation of annual general elections. Happy to discuss!
In friendship,
David Tehr (QA Coordinator)
on Whadjuk Noongar boodja in Perth, Western Australia
LikeLike